by Chris Turner
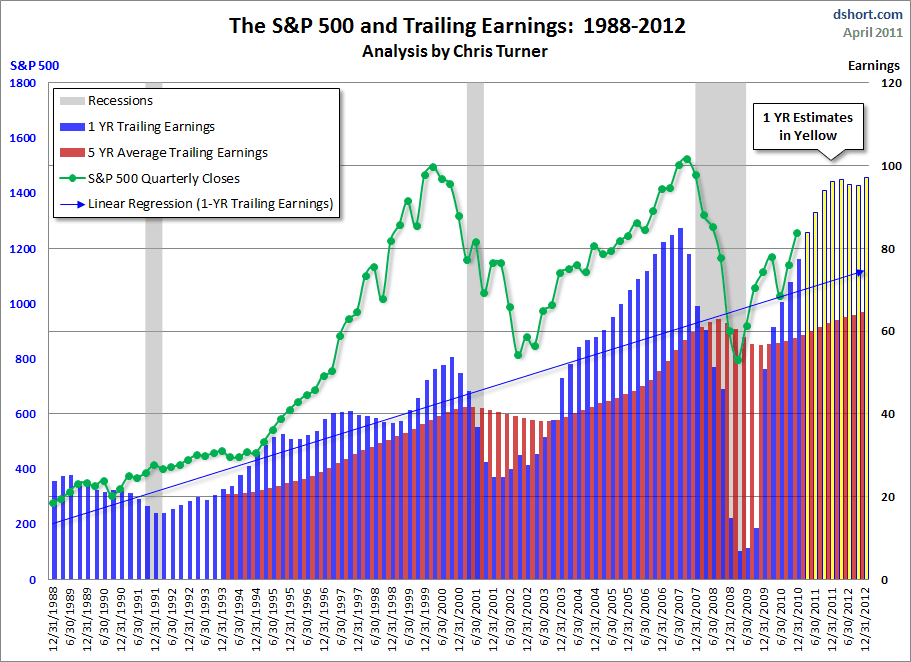
When questioned the other day about the relationship between trailing earnings and the S&P 500, I was inspired to create the chart below as a way to study the problem. The chart is based on Standard & Poor's Senior Index Analyst Howard Silverblatt's S&P earnings estimates spreadsheet. It shows the one-year trailing earnings for the S&P 500 in blue with a linear regression to highlight the trend.
The five-year average of trailing earnings in is shown in red. The Standard & Poor's one-year trailing estimates through 2012 are highlighted in yellow. The quarterly closes of the index itself are depicted in green.
Some initial observations:
- Trailing earnings peaks are increasing in frequency. The peak in earnings in 1989 and subsequent recession resulted in a small trough and a hiccup in the S&P 500. The next peak occurred in 2000, around ten years
Complete Story »
Tricia Vessey Aki Ross Ashley Tappin Carmen Electra Amanda Marcum
No comments:
Post a Comment