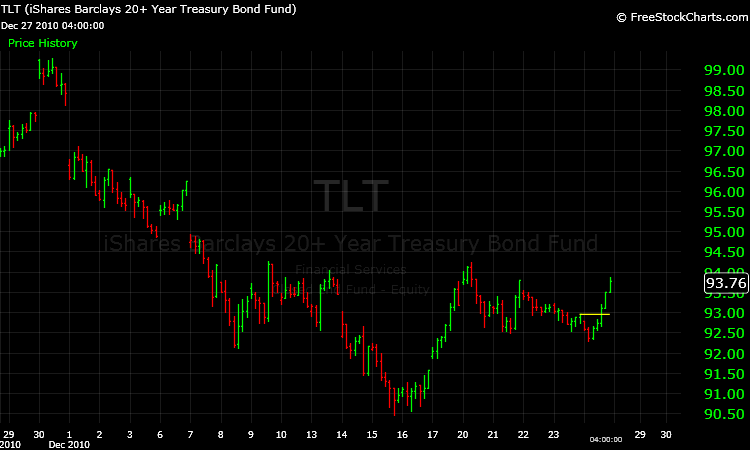
It is the week after Christmas and before New Year's, and I have seen some large moves during this period when the market is "thin". I was going through some charts on a casual work day and came across an interesting chart pattern for the long bond exchange traded fund, TLT. It is easy to see "Head and Shoulders" bottom. The chart is from freestockcharts.com:
The "neckline" is around the price of $94.25 ish. If the price does break this level soon, then the textbook interpretation of this pattern points to around a $3.75 move up to around $98. The $98 level is also "resistance"-- as shown on the daily TLT chart, which had a gap down that created an "island" reversal created from the gap up on November 30, 2010.
Complete Story »
Anna Paquin Diane Kruger Magdalena Wróbel Connie Nielsen Melissa George
No comments:
Post a Comment